In This Article
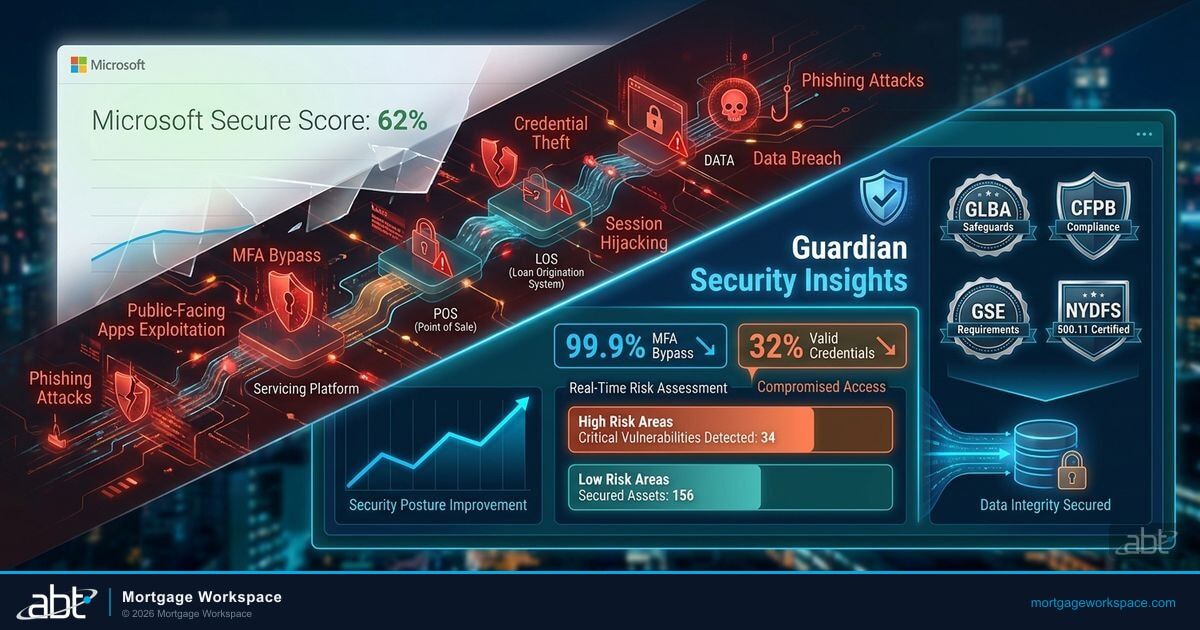
Microsoft Secure Score tells you how your M365 tenant stacks up against recommended controls. What it does not tell you is whether those recommendations are high enough. For mortgage companies, credit unions, and banks handling regulated financial data, "passing" is not the standard. The standard is resilience against the threats that actually target your industry.
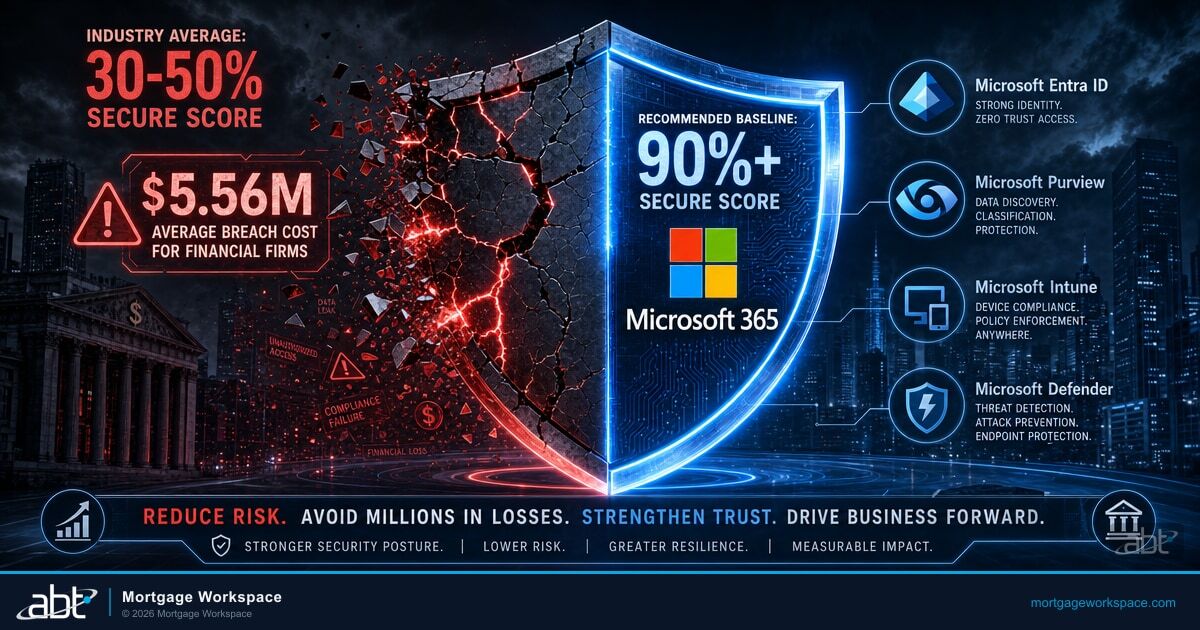
The average Microsoft 365 tenant scores between 30% and 50%. That means a score of 65% looks strong by comparison. But comparison to the average is a trap. Financial institutions that grade on Microsoft's curve are measuring themselves against organizations that have not touched their security settings since initial deployment. That is not a benchmark. That is a participation trophy.
With 84% of cyberattacks now involving identity compromise and financial services facing $5.56 million average breach costs, the gap between "above average" and "actually protected" has never been more expensive.
The Problem with Grading on a Curve
Secure Score operates like a classroom grading curve. Microsoft sets a maximum based on available controls. You earn points by enabling them. The resulting percentage tells you how far you have come toward your theoretical maximum.
The catch: many organizations score low. When the average sits at 40%, a score of 65% feels like an achievement. It earns a "B" in the comparison charts. But a 65% means 35% of recommended security controls remain disabled. In a financial institution handling borrower Social Security numbers, bank account details, and income verification documents, that 35% gap represents real attack surface.
Three specific problems emerge when financial institutions accept a curved grade.
Unaddressed Identity Gaps
A 65% score often means MFA is enforced for admins but not all users. Legacy authentication protocols remain active for "compatibility." Service accounts lack Conditional Access policies. These are exactly the gaps that attackers exploit. In IBM's 2025 Cost of a Data Breach Report, phishing overtook compromised credentials as the top initial attack vector, with credential-based breaches still averaging the highest time to identify and contain. Financial services breaches cost an average of $5.56 million per incident.
Incomplete Device Compliance
Partial Intune enrollment is common. Company laptops are managed, but personal devices accessing email and SharePoint are not. A curved grade treats partial enrollment as progress. An attacker treats an unmanaged device as an unlocked door to your tenant.
Missing Data Protection Controls
Data Loss Prevention policies are often the last controls organizations enable. They require planning, testing, and user communication. A curved score lets you skip them and still look good on paper. But DLP is where the FTC Safeguards Rule lives. Without it, sensitive borrower data leaves your environment through email attachments, Teams messages, and SharePoint sharing links without anyone knowing.
Where Does Your Tenant Actually Stand?
ABT's Security Grade Assessment shows you the gap between your Secure Score and the 90%+ standard that Guardian maintains for regulated financial institutions.
Why 90% Is the Standard, Not the Ceiling
Microsoft's own Digital Defense Report confirms that organizations scoring above 80% experience 67% fewer security incidents. That threshold is the starting point, not the finish line. Guardian pushes financial institutions to 90%+ because the controls between 80% and 90% address the regulatory and operational gaps that examiners specifically look for.
Financial services saw 739 data compromises in 2025, up from 733 the prior year, making it the most targeted sector according to the Identity Theft Resource Center's annual report. The FinWise Bank insider breach exposed data for 689,000 customers, and a ransomware attack on a financial software firm impacted more than 70 U.S. banks and credit unions. Regulators are responding with tighter examination standards and shorter reporting windows.
Regulatory Expectations Are Rising
The FTC Safeguards Rule requires mortgage companies to maintain comprehensive security programs, designate a Qualified Individual, and report breaches affecting 500+ customers within 30 days. The FFIEC IT Examination Handbook pushes banks toward continuous monitoring and risk assessment. NCUA expects credit unions to demonstrate measurable security controls and has made cybersecurity a 2026 supervisory priority.
None of these regulators grade on a curve. They look for specific controls. The gap between 65% and 90% on your Secure Score contains the exact controls regulators ask about: DLP policies, device compliance enforcement, application consent restrictions, and automated alerting.
Cyber Insurance Carriers Set Their Own Bar
Insurance underwriters pull security posture data as part of the application process. They set specific thresholds for MFA, endpoint detection and response, and email security. Coalition's claims data shows that 82% of denied cyber insurance claims involved organizations lacking MFA enforcement. A 65% Secure Score that "beats the average" may still fall below the carrier's minimum. Coverage exclusions, higher premiums, or outright denial follow.
82% of denied cyber insurance claims involved organizations that had not fully deployed multi-factor authentication across their environments. Carriers now require MFA on remote access, email, administrative accounts, and core financial systems as a baseline for coverage.
Board Expectations Follow Industry Headlines
Every financial services breach makes the news. Board members read those headlines. When they ask "Could that happen to us?", the answer depends on your actual controls, not your relative ranking. A 90%+ Secure Score means you have deployed the controls that prevent the most common attack patterns and satisfy examiner expectations. A 65% means you have not.
What the Gap Between 65% and 90% Actually Contains
The journey from 65% to 90% is not about obscure or low-value controls. It typically involves the protections that matter most for regulated data.

At 65% (Curved Grade)
- MFA for admins only
- Partial Intune enrollment
- No DLP policies active
- Default app consent settings
- No email authentication configured
- Static access rules only
At 90%+ (Guardian Standard)
- MFA enforced for all users
- Full device compliance enforcement
- DLP covering email, Teams, SharePoint
- Application consent restrictions active
- SPF, DKIM, DMARC configured
- Risk-based Conditional Access policies
- MFA for all users, not just admins. Attackers target loan officers and processors because they have access to borrower data. Admin-only MFA leaves the majority of your workforce unprotected.
- Full device compliance enforcement. Moving from "enrolled" to "compliant" means devices must meet encryption, OS update, and security baseline requirements before accessing data.
- DLP policies covering email, Teams, and SharePoint. Preventing sensitive data from leaving your controlled environment is a core expectation under GLBA and the FTC Safeguards Rule, not an optional enhancement.
- Application consent restrictions. Blocking users from granting permissions to unknown third-party apps prevents OAuth-based attacks that bypass MFA entirely.
- Email authentication (SPF, DKIM, DMARC). These controls prevent attackers from spoofing your domain to send phishing emails that appear to come from your organization.
- Automated risk-based Conditional Access. Policies that adapt based on sign-in risk level provide protection that static rules cannot match.
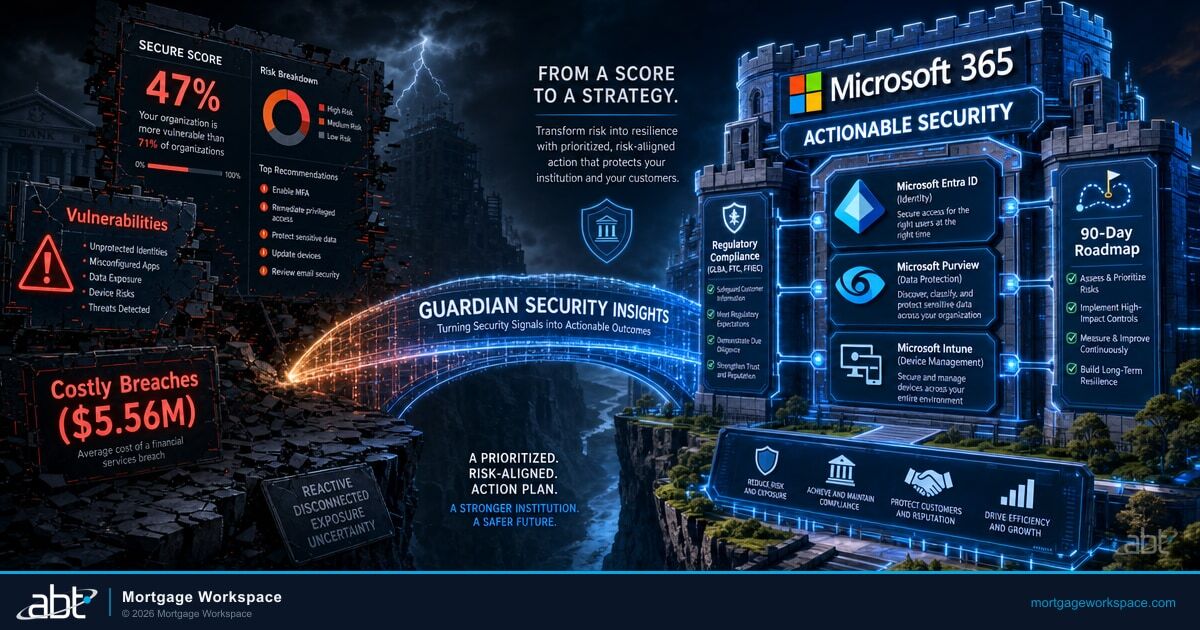
How Guardian Security Insights Sets Higher Standards
Guardian Security Insights is the security component of ABT's Guardian operating model for Microsoft 365 tenants. It rejects the curve and sets an absolute standard: 90%+ across all four Secure Score categories (Identity, Devices, Apps, Data), maintained continuously.
Guardian Security Insights achieves this through four functions.

Hardening
A 90-day sprint addressing every high-impact Secure Score control, plus ABT's baseline configurations developed across 750+ financial institutions
Monitoring
Continuous score tracking that flags drift before it becomes an exposure, even as Microsoft adds new controls quarterly
Security Insights
Category breakdowns, trend reporting, and risk prioritization translated for executives and board members
Response
Incident handling that closes the gap between detecting a problem and resolving it, cutting the global average breach lifecycle
Hardening That Goes Beyond Defaults
Guardian Security Insights applies a 90-day hardening sprint that addresses every high-impact Secure Score control. But it does not stop at the Microsoft-recommended settings. The hardening process adds ABT's own baseline configurations developed across 750+ financial institutions. These configurations address attack patterns specific to mortgage companies, credit unions, and banks that Microsoft's generic recommendations do not cover.
Monitoring That Catches Drift
A Secure Score does not stay static. Microsoft adds new controls quarterly. IT teams make changes that weaken policies. Employees request exceptions that create gaps. Guardian Security Insights monitors the score continuously and flags degradation before it becomes an exposure.
Security Insights That Translate for Executives
Raw Secure Score data is technical. Guardian Security Insights translates it into category breakdowns, trend reporting, and risk prioritization that executives and board members can act on. When a category drops below 90%, the reporting identifies the specific controls that changed and the business risk they represent.
Response That Closes the Loop
When monitoring detects an anomaly or an incident bypasses preventive controls, the Guardian response process activates. This closes the gap between detecting a problem and resolving it. Financial institutions cannot afford a breach lifecycle measured in months when regulators expect notification within 72 hours (NCUA) to 30 days (FTC Safeguards Rule for 500+ affected customers).
Organizations achieving above 80% Secure Score see 67% fewer security incidents, but Guardian targets 90%+ because the controls between 80% and 90% are where compliance evidence, advanced threat protection, and insurance leverage compound for regulated financial institutions.
Microsoft Digital Defense Report, 2025
The Pure Microsoft Stack Advantage
ABT runs a pure Microsoft technology stack. No ConnectWise. No Kaseya. No SolarWinds. Every security control, monitoring tool, and management platform is Microsoft-native: Entra ID, Intune, Defender for Endpoint, Defender for Office 365, Conditional Access, Purview, and Sentinel.
This matters for Secure Score because third-party MSP platforms introduce their own attack surface. The ConnectWise ScreenConnect breach in February 2024. The Kaseya VSA attack in July 2021. The SolarWinds supply chain compromise in December 2020. Each one affected thousands of MSP clients. ABT clients had zero exposure to all three because the architecture does not include those platforms.
Your MSP uses ConnectWise ScreenConnect for remote management. A vulnerability is exploited (as happened in February 2024), giving attackers administrative access to every client environment managed through that platform.
Your Secure Score showed 78% before the breach. But Secure Score only measures Microsoft 365 controls. It had no visibility into the third-party tool your MSP introduced. The attack surface that mattered most was invisible to your security metrics.
Your Secure Score measures your Microsoft 365 controls. If your MSP introduces non-Microsoft tools with their own vulnerabilities, your Secure Score cannot warn you about that additional risk. A pure Microsoft stack means your score reflects your actual security posture without hidden dependencies.
Building a Culture of Higher Standards
Setting a 90% minimum is not just a technical decision. It changes how your organization thinks about security.
- Accountability shifts from IT alone to the whole organization. When the score is visible and the target is clear, every department understands their role in maintaining it.
- Audit preparation becomes evidence collection, not scrambling. Regulatory audits ask for the controls that make up your Secure Score. When you are already above 90%, the evidence exists before the auditor arrives.
- Vendor evaluation gains a new dimension. Every third-party tool that connects to your M365 tenant affects your security posture. A higher standard means evaluating vendor access against your score impact.
- Security incidents drop measurably. The 67% reduction in incidents above 80% is well-documented, and at 90%+ the operational benefits compound further. It means fewer disruptions, fewer late-night calls, and fewer conversations with regulators about what went wrong.
Is Your Secure Score Protecting You or Just Grading You on a Curve?
ABT's Security Grade Assessment benchmarks your M365 tenant against the 90%+ standard that 750+ financial institutions maintain through Guardian Security Insights. See exactly where your gaps are and what they cost you in risk exposure.
Frequently Asked Questions
Microsoft's Digital Defense Report confirms organizations scoring above 80% experience 67% fewer security incidents. But 80% is only the inflection point. For financial institutions regulated by the FTC Safeguards Rule, FFIEC, and NCUA, the controls between 80% and 90% include advanced DLP policies, full device compliance, application consent restrictions, and sensitivity labels that examiners specifically evaluate during audits. Guardian targets 90%+ to cover these regulatory controls completely.
The average Microsoft 365 tenant scores between 30% and 50% because most organizations use default configurations. Measuring against this average makes a 65% score appear strong when it still leaves 35% of recommended controls disabled. For mortgage companies handling borrower data, those disabled controls often include DLP, full MFA enforcement, and device compliance policies that the FTC Safeguards Rule requires.
The gap between 65% and 90% typically contains MFA for all users beyond administrators, full Intune device compliance enforcement, Data Loss Prevention policies for email and Teams, application consent restrictions, email authentication protocols including SPF, DKIM, and DMARC, and risk-based Conditional Access policies. These controls prevent the most common attack patterns targeting financial institutions.
Secure Score measures Microsoft 365 controls exclusively. When an MSP introduces third-party platforms like ConnectWise or Kaseya, those tools create additional attack surface that Secure Score cannot measure. A pure Microsoft stack ensures the score reflects actual security posture without hidden dependencies from platforms with their own breach history, including ConnectWise ScreenConnect in 2024 and Kaseya VSA in 2021.
Guardian Security Insights uses a continuous four-phase cycle. Hardening applies high-impact configurations during a 90-day sprint. Monitoring tracks the score and flags drift as Microsoft adds new controls quarterly. Security Insights translates technical data into executive reporting with category breakdowns and trend analysis. Response handles incidents when preventive controls are bypassed, maintaining the score above 90% as an ongoing standard.