In This Article
- The Economics of Mortgage Technology Ecosystems
- Three Pillars: CRM, POS, and LOS Integration
- Automation That Cuts Cost Per Loan
- Verification Intelligence: Where the Biggest Savings Hide
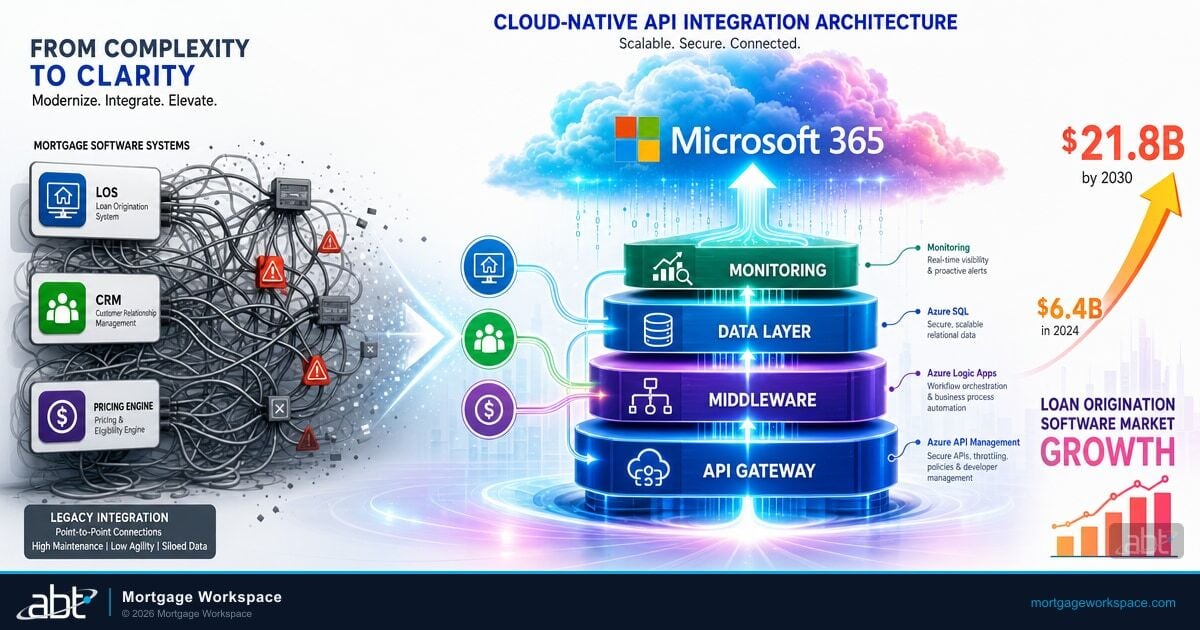
- Architecture That Scales Without Proportional Cost
- The KPI Framework That Drives Continuous Improvement
- MortgageWorkSpace and MortgageExchange: ABT's Productized Stack
- Mortgage BI Dashboards and M365 Guardian: Visibility Plus Governance
- Implementation Sequence: Where to Start for Maximum ROI
- Frequently Asked Questions
The Mortgage Bankers Association reported that total loan production expenses reached $11,076 per loan in 2024. That number has climbed steadily for three years running, and lenders with fragmented technology stacks are absorbing the worst of it. STRATMOR Group data shows that lenders using disconnected systems face per-loan costs up to 30% higher than peers with integrated platforms.
The gap between high-performing lenders and everyone else is widening. Freddie Mac research confirms that lenders using digital mortgage processes spend $2,200 less per loan than those relying on manual workflows. High adopters of automation save an additional $1,500 per loan beyond that baseline. These are not theoretical projections. They are measured cost differences between lenders operating on connected ecosystems and lenders still patching together disconnected tools.
This playbook covers how to build a mortgage technology ecosystem that reduces cost per loan, scales with volume changes, and delivers measurable operational improvements. It covers the core technology pillars, integration architecture, automation priorities, KPI frameworks, and the implementation sequence that produces the fastest return. It also explains how Access Business Technologies operates the productized version of that stack on Microsoft 365 for more than 750 banks, credit unions, and mortgage companies through MortgageWorkSpace, MortgageExchange, Mortgage BI, and the M365 Guardian operating model.
The Economics of Mortgage Technology Ecosystems
Technology spending represents 5 to 10 percent of total loan production expenses, roughly $500 to $1,000 per loan according to STRATMOR Group benchmarks. That is a relatively small investment compared to the personnel costs, compliance overhead, and operational inefficiencies it can eliminate.
The math works like this. A lender processing 2,000 loans per year that reduces cost per loan by $1,500 through technology integration saves $3 million annually. The technology investment itself represents a fraction of that return. The issue is never whether technology pays for itself. The issue is whether the technology works as a connected system or as isolated tools that create their own overhead.
Connected ecosystems produce measurable advantages across three dimensions.
ICE Mortgage Technology data shows integrated platforms reduce cycle times by 3 days on average. Freddie Mac's Loan Product Advisor update shortened production cycles by 5 days while qualifying 18,000 additional borrowers.
ICE reports a 13% reduction in error rates for lenders using integrated platforms. Fewer errors mean fewer repurchase demands, fewer compliance findings, and less rework.
ICE data shows integrated lenders increase gross profit per loan by $1,056. That improvement comes from reduced labor per file, fewer fallout loans, and faster pull-through rates.
The economic case for integration is clear. The challenge is building the connections in the right order, which is what the rest of this playbook covers.
Three Pillars: CRM, POS, and LOS Integration
Every mortgage technology ecosystem rests on three core systems. The CRM manages relationships and pipeline visibility. The POS captures borrower data and documents at the point of application. The LOS processes the loan through underwriting, compliance, and closing. When these three systems share data through API connections, the entire operation accelerates.
CRM: Pipeline Visibility and Borrower Lifecycle Management
A connected CRM eliminates the information gaps that slow down loan officers. When a borrower submits a pre-qualification through the POS, the CRM captures that activity automatically. When the loan moves to processing, the CRM updates the pipeline stage without manual input. When the loan closes, the CRM triggers post-close nurture sequences that feed the referral pipeline.
Industry data shows that referrals drive approximately 40% of new mortgage business. A CRM that tracks every borrower interaction from first contact through post-close follow-up protects that revenue stream. The critical requirement is bidirectional data flow. The CRM should receive updates from the LOS and push relationship context back to loan officers working in the POS.
POS: Data Collection That Eliminates Downstream Rework
The POS determines the quality of every file that enters your pipeline. A well-designed POS collects verified data at the point of application through real-time credit pulls, income verification APIs, and document capture with OCR validation. When the POS delivers a complete, verified file to the LOS, processors work exceptions instead of chasing missing documents. See how POS interfaces speed up mortgage pre-qualification for the detailed walkthrough of that data path.
Research shows that lenders with integrated POS-to-LOS connections reduce processing time by 15 to 30 minutes per file on routine data transfer alone. Multiply that across thousands of loans and the labor savings are substantial.
LOS: The Processing Engine That Connects Outward
The LOS handles underwriting, compliance checks, third-party orders, and closing preparation. Modern LOS platforms connect to credit bureaus, appraisal management companies, title providers, and automated underwriting systems through API integrations that execute within the loan workflow.
The most effective LOS implementations treat the system as an integration hub rather than a standalone processing tool. Every third-party service connects through the LOS so data enters the ecosystem once and flows to every system that needs it. Freddie Mac data shows that automated underwriting through LPA returns decisions in minutes for standard profiles, and lenders using these integrations cut production cycles by 5 days on average. The broader picture appears in our overview of the fintech mortgage ecosystem from borrower apps to secondary market integration.
Automation That Cuts Cost Per Loan
Integration connects the systems. Automation eliminates the manual steps between them. The highest-value automation targets fall into three categories: document processing, workflow progression, and compliance enforcement.
Document processing automation. Intelligent document processing uses OCR and machine learning to classify documents, extract data fields, and cross-reference extracted values against application data. When a borrower uploads a pay stub, the system reads the income figure, maps it to the loan file, and flags any discrepancy with the stated income on the application. Staff review exceptions rather than processing every document manually.
Workflow progression automation. Rule-based engines advance loans through pipeline stages when specific conditions are met. When verified income and assets exceed program thresholds, the system orders the appraisal automatically. When the appraisal clears, the system generates the closing disclosure. Each automated step removes a manual handoff and the delay that comes with it.
Compliance enforcement automation. TRID timing rules, fee tolerance calculations, and disclosure delivery requirements follow predictable logic. Automated compliance systems track every deadline, block actions that would create violations, and generate audit-ready documentation at every step. These automations prevent the most expensive errors in mortgage lending: tolerance cures that cost $500 to $2,000 per incident and regulatory findings that carry penalties orders of magnitude higher.
Freddie Mac data confirms that high adopters of automation save approximately $1,500 per loan. For a lender processing 3,000 loans per year, that translates to $4.5 million in annual cost reduction.
Verification Intelligence: Where the Biggest Savings Hide
Income and employment verification is one of the most labor-intensive steps in mortgage origination. Traditional verification requires phone calls to employers, faxed forms, and manual data entry. The process takes days and consumes significant staff time per file.
Automated verification platforms connect directly to employer payroll systems through APIs. Argyle, one of the leading verification platforms, reports a 55% average conversion rate on payroll connections and 88% cost savings per loan compared to traditional verification methods. The data flows directly into the loan file without manual entry, and the verification is timestamped and audit-ready.
The Work Number, Plaid, and similar services provide additional verification pathways. The most effective ecosystems support multiple verification sources and route each request to the provider most likely to return data for that specific employer. When the primary source fails, the system automatically tries secondary sources before falling back to manual verification.
Beyond cost savings, automated verification improves data quality. Payroll-connected income data is more accurate than borrower-reported figures, which reduces conditions, speeds underwriting, and lowers repurchase risk on the secondary market.
Architecture That Scales Without Proportional Cost
Mortgage volume is cyclical. Rate drops trigger refinance waves. Spring buying seasons spike purchase volume. A technology ecosystem that requires proportional staff increases for every volume change cannot deliver consistent margins.
Scalable architecture relies on three design principles.
Cloud platforms scale compute and storage automatically with demand. Instead of purchasing server capacity for peak volume and paying for idle resources during slow periods, cloud infrastructure adjusts in real time. This approach reduces infrastructure costs by 30 to 50 percent compared to on-premises deployments.
When every system connects through documented APIs, adding new tools or replacing underperforming vendors does not require rebuilding the ecosystem. New integrations plug into existing data flows.
Automated workflows that run verification, appraisal, title, and compliance checks simultaneously instead of sequentially compress cycle times. When volume increases, parallel processing absorbs the additional load without creating sequential bottlenecks.
ICE Mortgage Technology data shows that lenders using integrated platforms achieve 23% higher operational leverage. That means they process more loans per employee without degrading quality or compliance. This operational leverage is the mechanism that allows integrated lenders to maintain margins during volume fluctuations.
The KPI Framework That Drives Continuous Improvement
An ecosystem that runs without measurement runs without direction. The following KPIs provide the feedback loop that identifies bottlenecks, validates investments, and drives continuous improvement.
Cost Per Loan
The MBA benchmark of $11,076 per loan is the industry average. Track your cost per loan monthly and compare it to your pre-integration baseline. Integrated ecosystems should show a declining trend as automation absorbs more manual steps. A reasonable target for a well-integrated lender is 10 to 15 percent below the MBA average within the first year of implementation.
Cycle Time (Application to Funding)
The industry average hovers near 43 days. Lenders with integrated ecosystems consistently close in 30 to 35 days. Track this metric by loan type and identify which stages consume the most time. Often, the bottleneck is not underwriting but document collection and verification, which is why automating those steps produces the largest cycle time improvements.
Processing Capacity Per Employee
This metric reveals whether your technology investment is creating operational leverage. If loans per processor per month increase without quality degradation, your ecosystem is delivering. If the number stays flat despite technology investment, the integration points between systems need attention.
Error Rate and Rework Percentage
Track the percentage of loans requiring rework due to data errors, missing documents, or compliance issues. ICE data shows a 13% reduction in error rates for integrated platforms. Each error avoided saves the cost of correction plus the opportunity cost of delayed closings.
Borrower Satisfaction and Application Completion Rate
Application abandonment rates reveal friction in the borrower experience. Post-close surveys measure the full journey. Together, these metrics show whether your ecosystem improvements are reaching the borrower or only benefiting internal operations.
MortgageWorkSpace and MortgageExchange: ABT's Productized Stack on Microsoft 365
Most lenders try to assemble the ecosystem described above by stitching together vendor relationships, custom integrations, and one-off automations. Access Business Technologies operates the productized version of that stack on Microsoft 365 for more than 750 banks, credit unions, and mortgage companies. MortgageWorkSpace is the productized environment that runs a lender's CRM, POS, LOS connections, document management, and analytics inside a single Microsoft 365 tenant that ABT manages under the Cloud Solution Provider program. MortgageExchange is the integration layer underneath it, the data lake and interface engine that has been built and battle-tested against Encompass, Byte, MeridianLink, Calyx PointCentral, Symitar, Episys, Jack Henry, FIS, Fiserv DNA, and custom platforms across two decades of FI deployments. Together they replace the months-of-stitching pattern with a configured stack that already understands mortgage data structures and the integration points the rest of this playbook describes.
The productized model matters because the playbook above takes most lenders 12 to 18 months to assemble piece by piece. With MortgageWorkSpace and MortgageExchange, the POS-to-LOS connection that this article recommends as Phase 1 already exists. The verification integrations described in Phase 3 already exist. The compliance automation framework described in Phase 4 already exists. What remains is configuring the stack against the lender's existing CRM, POS, and LOS choices and tuning the workflows to the institution's product mix and branch geography. That work takes weeks, not months, because the integration plumbing is already in place.
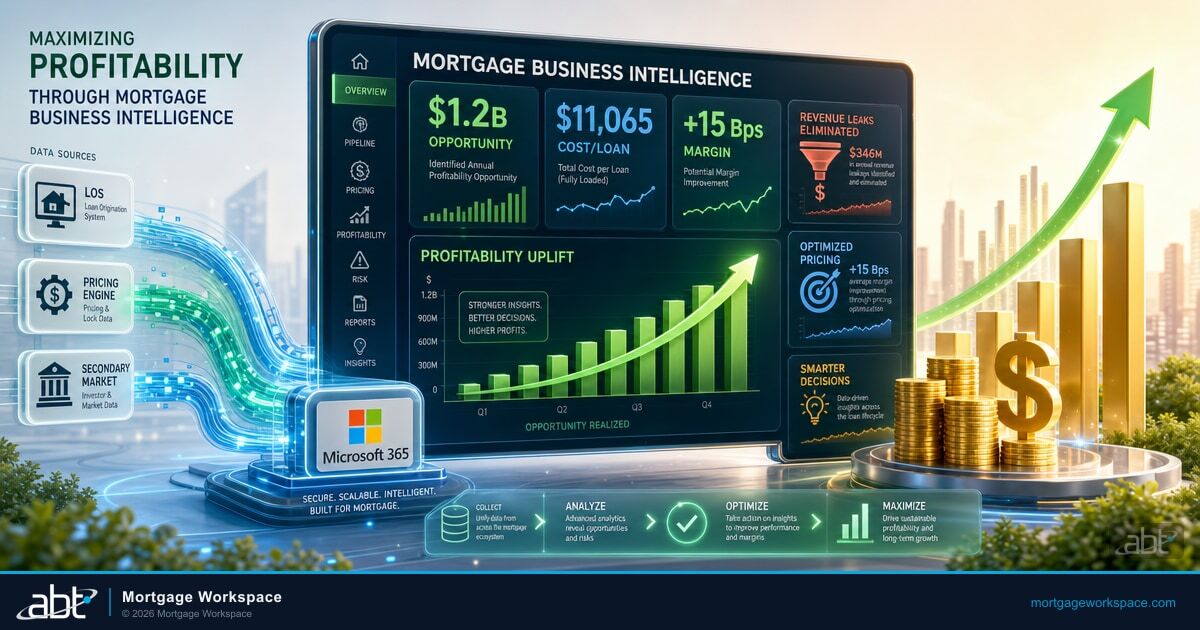
Mortgage BI Dashboards and M365 Guardian: Ops Visibility Plus Security and Governance
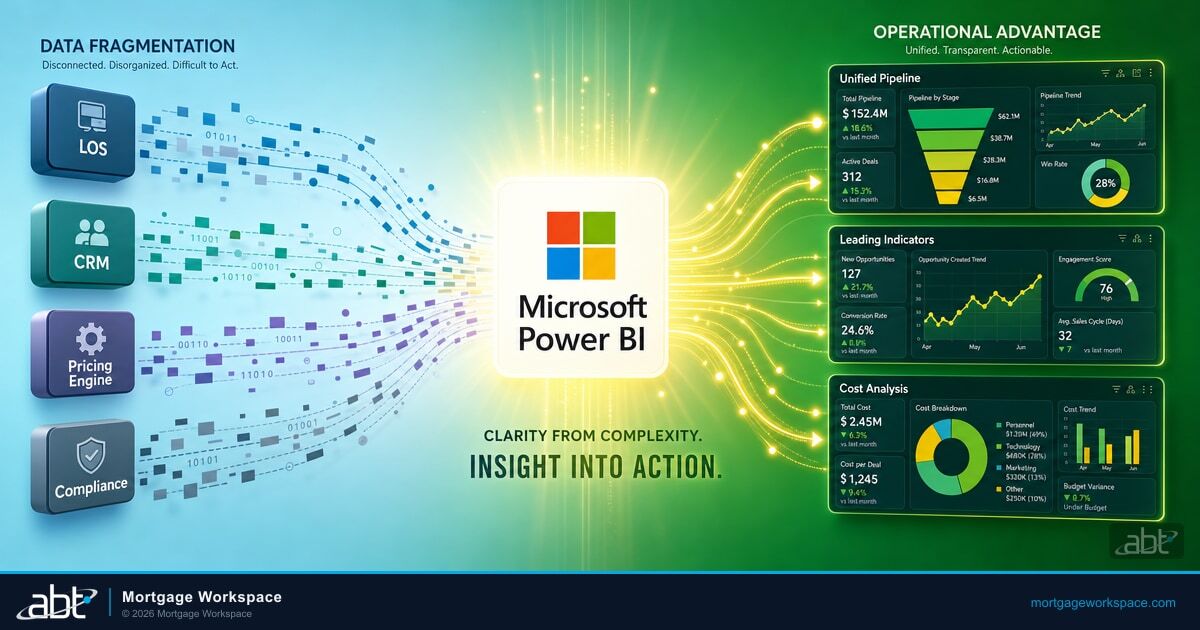
Mortgage BI is the operational visibility layer that sits on top of MortgageExchange. It is the dashboard surface that turns the data flowing through the connected ecosystem into the KPI framework this playbook describes: cost per loan tracked monthly against the MBA benchmark, cycle time by loan type and stage, processing capacity per employee, error rate trends, and borrower satisfaction by branch and channel. Loan officers, processors, underwriters, branch managers, and the CFO each get a view tuned to the decisions they actually make. The dashboards refresh against current pipeline and servicing data, so the conversation about volume, capacity, and margin happens against the real numbers rather than a month-old spreadsheet pulled by hand.
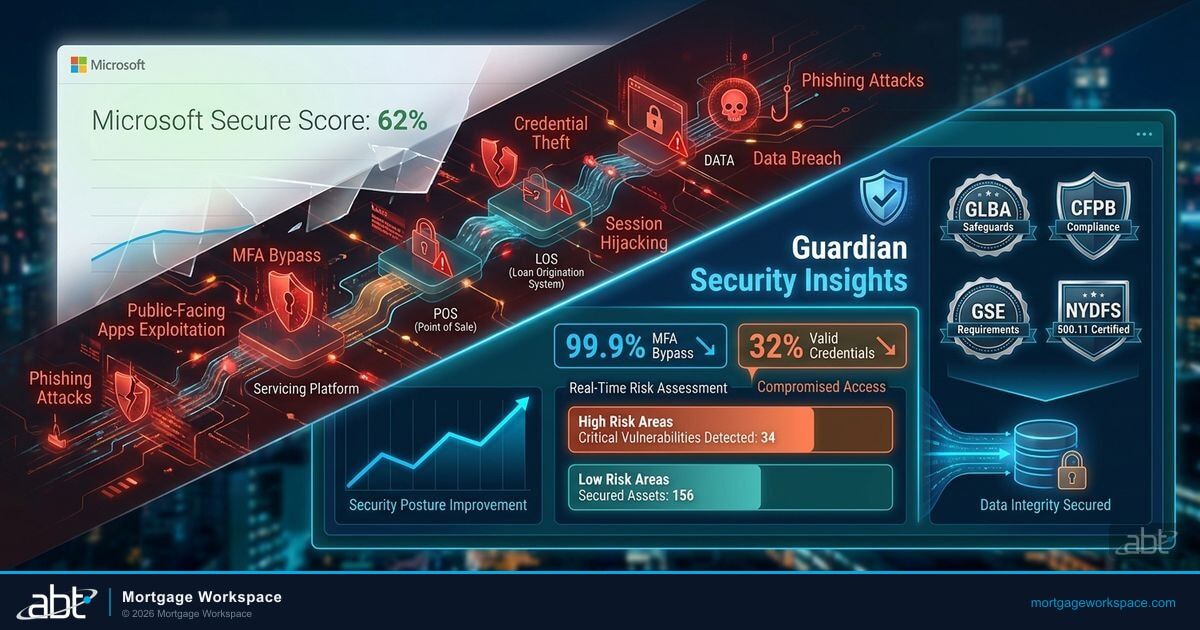
M365 Guardian is the operating model that holds the security and governance posture around that data and dashboard surface. Microsoft Entra ID Conditional Access controls who can sign into MortgageWorkSpace and Mortgage BI from which devices. Microsoft Intune enrolls and posture-checks every device that touches loan files. Microsoft Defender for Office 365 and Defender for Endpoint handle the active threat side. Microsoft Purview Audit, Information Protection, and retention policies hold up the books-and-records side that examiners review. ABT manages the Microsoft 365 tenant where MortgageWorkSpace, MortgageExchange, and Mortgage BI run, applies these Microsoft controls consistently across the tenant, and produces the audit evidence an FFIEC, NCUA, or CFPB examiner asks for. The ops visibility and the examiner-facing audit trail come out of the same governed footprint.
Key Takeaway
The phased mortgage technology playbook is the right map. MortgageWorkSpace, MortgageExchange, Mortgage BI, and M365 Guardian are the productized version of that map running on Microsoft 365 for more than 750 banks, credit unions, and mortgage companies. Lenders that adopt the productized stack reach the integrated, automated, governed end state in weeks instead of the 12 to 18 months a do-it-yourself integration usually takes.
Implementation Sequence: Where to Start for Maximum ROI
Ripping out existing systems and starting over is rarely practical. The implementation sequence below prioritizes the changes that deliver the fastest measurable return.
Phase 1: Connect POS to LOS (Weeks 1-4). This single integration eliminates the most common source of manual data transfer. When borrower data flows from the POS to the LOS without re-keying, you immediately reduce processing time and data entry errors. Most major LOS platforms have API endpoints ready for POS connections. MortgageExchange has prebuilt connectors for the major LOS, POS, and core banking platforms used across the FI vertical.
Phase 2: Add document intelligence (Weeks 4-8). Layer OCR classification and data extraction onto your existing document upload workflow. This reduces document handling time by 6+ hours per loan and delivers the highest single-step labor savings in the pipeline.
Phase 3: Automate verification (Weeks 6-10). Connect to automated income and employment verification services. With 88% cost savings per verification reported by leading platforms, this step produces immediate and measurable cost reduction.
Phase 4: Build compliance automation (Weeks 8-14). Implement TRID timing enforcement, fee tolerance validation, and automated audit trail generation. These automations prevent the most expensive errors and reduce audit preparation from days to hours.
Phase 5: Integrate CRM and establish KPI dashboards (Weeks 12-16). Connect the CRM to receive pipeline data from the LOS and borrower activity from the POS. Build dashboards that track the KPIs defined above. Mortgage BI is the productized version of this KPI dashboard surface for lenders running MortgageWorkSpace, with pre-configured views for cost per loan, cycle time, processing capacity, error rate, and borrower satisfaction.
Build the productized version of this playbook for your institution
ABT operates MortgageWorkSpace, MortgageExchange, Mortgage BI, and the M365 Guardian operating model inside the Microsoft 365 tenant we manage for more than 750 banks, credit unions, and mortgage companies. A 30-minute conversation maps your current stack, identifies the highest-ROI phase to start with, and outlines what an ABT-managed deployment would cover.
Frequently Asked Questions
STRATMOR Group data shows lenders with fragmented technology stacks face per-loan costs up to 30% higher than peers using integrated platforms. With the Mortgage Bankers Association reporting average production expenses of $11,076 per loan, that gap translates to more than $3,000 per loan in unnecessary cost for lenders running disconnected systems. MortgageWorkSpace and MortgageExchange close that gap by giving lenders a productized integrated stack on Microsoft 365 rather than a custom assembly project.
Connect your POS to your LOS through API integration. This eliminates the most common source of manual data transfer and re-keying errors. Most major LOS platforms have API endpoints ready for connection, and this single step saves processors 15 to 30 minutes per file on routine data handling. MortgageExchange ships with prebuilt connectors for Encompass, Byte, MeridianLink, Calyx PointCentral, and the other major LOS platforms, so the connection that takes a do-it-yourself team weeks of work is configuration rather than custom build.
Automated verification platforms connect to employer payroll systems through APIs, replacing manual phone calls, faxed forms, and data entry. Leading platforms report 88% cost savings per verification compared to traditional methods. The data flows directly into the loan file, improving both speed and accuracy. MortgageWorkSpace routes verification requests through the configured provider mix and falls back across multiple sources so the lender does not have to manage that orchestration by hand.
Track five core metrics: cost per loan against the Mortgage Bankers Association average, cycle time from application to funding, processing capacity per employee, error rate and rework percentage, and borrower satisfaction scores. Together these reveal whether your technology investment is producing operational leverage and cost reduction. Mortgage BI provides these views pre-configured against MortgageExchange-fed pipeline and servicing data, so the CFO, the head of operations, and individual branch managers see the same numbers refreshed against current loan activity.
Yes. Most ecosystem improvements work alongside existing systems through API integration. Start by connecting your POS to your LOS, then layer document intelligence and automated verification. Add compliance automation and CRM integration in later phases. Each step delivers standalone value without requiring a full system replacement. MortgageExchange is built around the principle that the lender keeps its existing LOS, POS, and core banking choices and the integration layer adapts to them rather than the other way around.
The phased playbook in this article takes most lenders 12 to 18 months to assemble piece by piece, with vendor selection, integration build, testing, and rollout repeated for each phase. MortgageWorkSpace is the productized version that runs the same CRM, POS, LOS, document, verification, and analytics surface inside a single Microsoft 365 tenant that ABT manages. MortgageExchange supplies the integration layer with prebuilt connectors. Mortgage BI supplies the KPI dashboard surface. The M365 Guardian operating model holds the security and audit posture. Lenders reach the integrated end state in weeks instead of the multi-year custom build cycle.
Examiners apply the FFIEC IT Examination Handbook risk management, audit, and information security expectations to every system used to originate, process, and service loans. M365 Guardian is ABT's operating model for the Microsoft 365 tenant where MortgageWorkSpace, MortgageExchange, and Mortgage BI run. It ties Microsoft Entra ID Conditional Access, Microsoft Intune device compliance, Microsoft Defender threat detection, and Microsoft Purview Audit, Information Protection, and retention policies into a single examination-ready posture. The borrower-facing dashboards and the examiner-facing audit trail come out of the same governed Microsoft 365 footprint.