In This Article
Mortgage lenders are operating at the highest per-loan production cost in industry history, and the gap between top-performing and average lenders keeps widening. The Mortgage Bankers Association's most recent Quarterly Mortgage Bankers Performance Report put IMB per-loan production expense at $11,102 in Q4 2025, well above the long-run average of $7,846 per loan since 2008. The difference between lenders who manage that pressure and the ones drowning in it usually comes down to one thing: visibility.
Business intelligence tools give mortgage operations leaders the line of sight they need to cut waste, price smarter, and allocate resources where they generate the highest return. Mortgage BI is purpose-built for this work: it connects your loan origination system, pricing engine, and secondary market data into dashboards that show exactly where margin is being gained or lost, in real time. Here is how to use it.
Across more than 750 banks, credit unions, and mortgage companies that ABT supports, the lenders who close the cost gap fastest are the ones who treat BI as a daily operating tool, not a month-end report. The sections below walk through the five highest-leverage views and how to stand them up.
Finding Revenue Leaks in Your Pipeline
Every mortgage pipeline has leaks. Loans fall out. Rate locks expire. Conditions sit uncleared for weeks. The question is whether you can see them in real time or whether you only discover them in monthly reports, when the loan is already lost.
BI dashboards solve this by tracking pull-through rates at every stage. When you can see that 23% of loans are falling out between conditional approval and clear-to-close, you can investigate why. Maybe it is a documentation bottleneck. Maybe it is a specific loan officer who is not following up. Maybe it is a product type that attracts borrowers who shop and disappear. Whatever the cause, you cannot fix what you cannot see, and monthly P&L statements show the damage after it is done. Mortgage BI's real-time pipeline analytics show the problem while you can still save the loan.
Why this matters more in 2026
MBA research published in mid-2025 surfaced what the industry now calls the "forgotten 40%" of origination costs: rework, late-stage defect discovery, and downstream corrections that never appear cleanly on the income statement. With defect rates approaching the 2% systemic-breakdown threshold, every uncaught issue compounds. BI dashboards make those costs visible at the moment they happen, not three weeks later.
Start with the five pipeline stages where dollars leak fastest. Each one of these is a metric a mid-size lender's BI dashboard should refresh daily, not weekly.
| Pipeline Stage | Leak Pattern | BI Signal to Watch |
|---|---|---|
| Application to Setup | Incomplete docs delay file movement; some applications never advance | Average days in stage; stuck-file alerts after 5 days |
| Setup to Underwriting | Conditions added late create rework; some borrowers walk during the wait | Condition-list growth rate per file; reopened-condition count |
| Underwriting to CTC | Largest single fallout stage industry-wide; documentation and verification gaps | CTC pull-through %, conditional-approval-to-CTC days, top fallout reasons |
| CTC to Funding | Rate lock expirations, last-minute borrower changes, closing schedule conflicts | Locks-within-7-days-of-expiry queue; lock extension cost YTD |
| Funding to Sale | Best-execution misses, slow document delivery to investor, post-close defects | Days-to-investor-purchase; pair-off cost; investor kickback rate |
None of these are exotic metrics. They are the routine operational signals that most LOS systems already capture but rarely surface in a way that triggers action. A BI dashboard built on top of the LOS turns them from inert data into a daily worklist.

Pricing Optimization Through Data
Pricing is where most lenders leave the most money. Price too high and borrowers go to competitors. Price too low and you erode margin on every loan you close. The lenders who get pricing right do it with daily best-execution visibility, not gut feel.
BI tools that integrate with your pricing engine and secondary market data show you exactly where you stand. The metrics that move the needle are:
- Margin by product type: which products generate the highest gain-on-sale, which ones are break-even, which ones are underwater after you account for cost-to-originate
- Competitive pricing position: how your rates compare to market benchmarks by geography and product, refreshed multiple times per day
- Rate lock performance: how often borrowers lock vs. float, and what that behavior costs you in hedge exposure
- Concession tracking: how much margin you give away in pricing exceptions, and whether those concessions are justified by retention data
The original framing in this space, lenders recovering 5-15 basis points of margin through pricing analytics, still holds for a typical implementation. What the latest case studies show is how much further the top deciles have pushed it. Independent analysis by MarketWise Advisors found Optimal Blue customers reported $1,006 in net benefit per loan on average, including $401 from hedging and secondary marketing analytics and $182 from pricing-accuracy improvements. Utah Community Credit Union's published case study documents 25 to 29 basis points of margin pickup converting from best-efforts to mandatory delivery with PPE-driven best-execution.
Benchmark: what mature pricing analytics deliver
MarketWise Advisors' 2026 ROI study of Optimal Blue customers measured an average $1,006 net benefit per loan against the PPE investment, with the largest contributions coming from secondary-marketing optimization and reduced pricing variance. The point of the figure is not that every lender will see exactly that number. The point is that the upside scales with how disciplined the dashboard usage is.
Lenders who use analytics to optimize pricing in the 5-15 basis point range typically see margin gains of $200 to $600 on a $400,000 loan. Multiply across volume and the impact compounds. Lenders who push into the upper deciles, with daily best-execution discipline and mandatory delivery, capture more.
Branch and Loan Officer Performance Analytics
Not all production is profitable production. A loan officer who closes high volume but requires heavy concessions and generates frequent repurchase demands may cost the firm more than they earn. BI platforms let you build performance scorecards that go beyond volume.
The metrics that matter for profitability:
- Revenue per loan by originator: factors in concessions, lock extensions, and rework costs, not just headline gross margin
- Cycle time by branch: how fast each location moves loans from application to funding, and where the bottlenecks sit
- Fallout rate by originator: who loses the most loans before closing, and at which stage
- Early payment default rates: which originators produce loans that go delinquent within the first 12 months, and what that costs in repurchase exposure
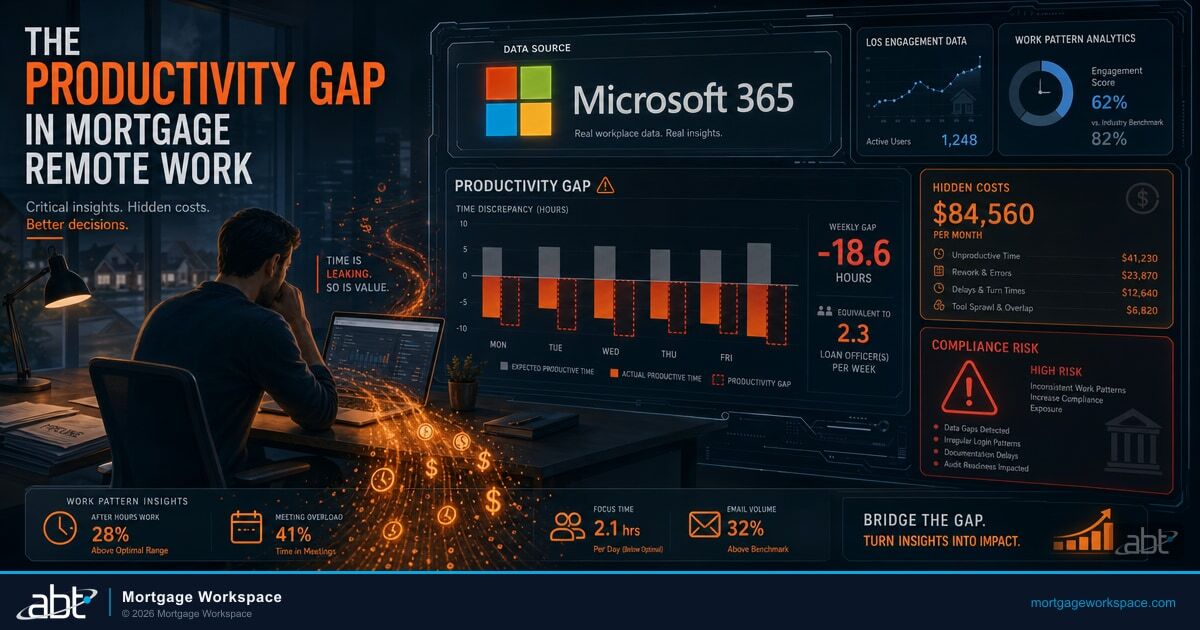
This data drives better management decisions. Guardian Productivity Insights takes this further by measuring operational efficiency at the team level, showing where workflow bottlenecks slow production and where process improvements will have the greatest impact on profitability. It identifies who needs coaching, which branches need operational support, and where to invest in growth vs. where to pull back.
STRATMOR data shows large banks now spend $13,628 per loan to produce a mortgage while large IMBs spend $10,095, a $3,533 per-loan productivity gap that compounds every quarter the analytics gap goes unaddressed.
That gap is not destiny. It is the cumulative result of operational decisions made with or without data. The lenders closing it are the ones building branch-level P&L visibility into the weekly management cadence, not waiting for quarterly board meetings to discover the trend.
Want to see your branch and originator analytics in one view?
Mortgage BI builds branch-level P&L dashboards on top of your existing LOS data. ABT manages the integration, the security configuration, and the ongoing tuning so your operations team can act on the data, not maintain the pipeline.
Reducing Cost Per Loan with BI Dashboards
The MBA's latest Quarterly Mortgage Bankers Performance Report put IMB per-loan production expense at $11,102 in Q4 2025. Top-quartile lenders operate well below that number. The gap comes down to operational efficiency, and BI is the tool that makes efficiency visible at the level of decisions individual managers can act on.
Cost-per-loan dashboards break down where the money goes:
- Personnel costs by function: processing, underwriting, closing, and post-closing labor hours per loan, with overtime and contract labor broken out
- Technology costs per loan: what you pay per unit for the LOS, pricing engine, AVMs, fraud tools, and verification services
- Rework and exception costs: how many loans require re-underwriting, re-disclosure, or condition extensions, the heart of MBA's "forgotten 40%" framing
- Compliance and QC costs: pre-funding and post-closing quality control expenses per loan, including defect cure costs

When your post-closing team spends 40% of their time on rework caused by incomplete documentation at origination, you know where to focus process improvement. Document Guardian reduces that rework by enforcing document security and compliance policies at the point of origination, catching missing or non-compliant files before they create downstream problems. Without it, the rework cost shows up in the cost-per-loan dashboard every month, and nobody has the leverage to fix the root cause.
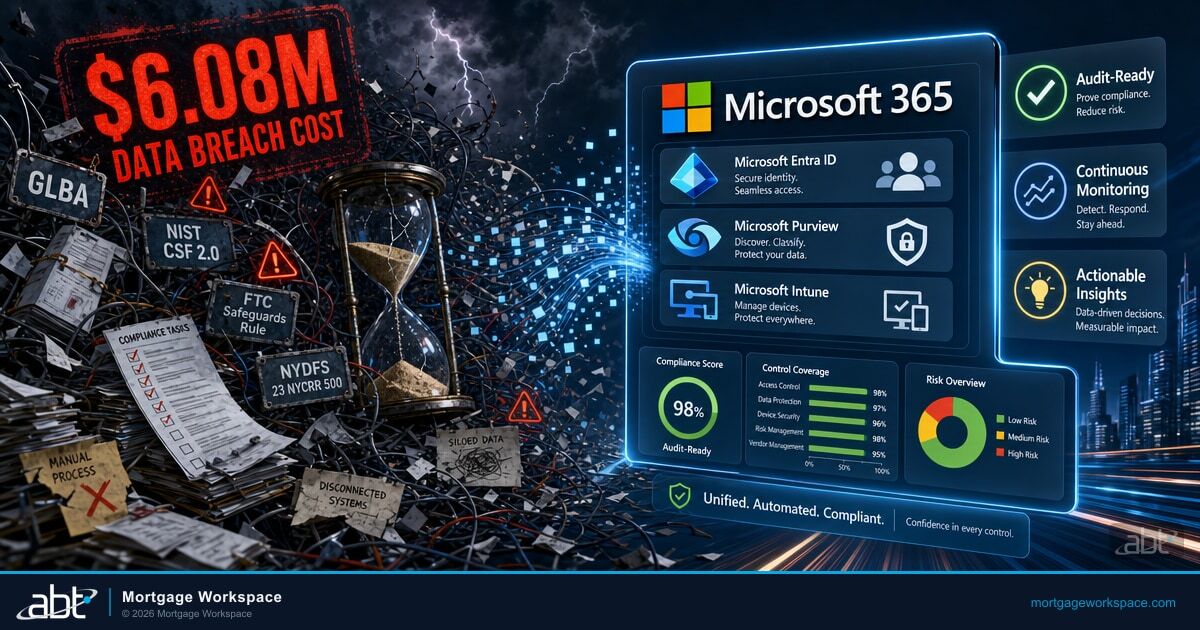
Mortgage BI dashboards do not stand on their own. They consume data from the LOS, the pricing engine, the secondary marketing system, and the document repository, and they have to do it inside a tenant that meets examiner expectations. ABT manages the Microsoft 365 tenant where Mortgage BI lives, configures the Microsoft Purview data-loss-prevention and audit policies that protect the underlying borrower data, and integrates the BI surface with Microsoft Entra ID Conditional Access so the right people see the right dashboards. That is the part most internal IT teams underestimate: the BI tool is the visible layer, but the Microsoft 365 governance underneath is what keeps the data trustworthy.
Secondary Market Execution and Gain-on-Sale
For lenders who sell on the secondary market, gain-on-sale is the primary profitability metric. BI tools that connect to your secondary marketing desk provide visibility into execution quality that nothing else does.
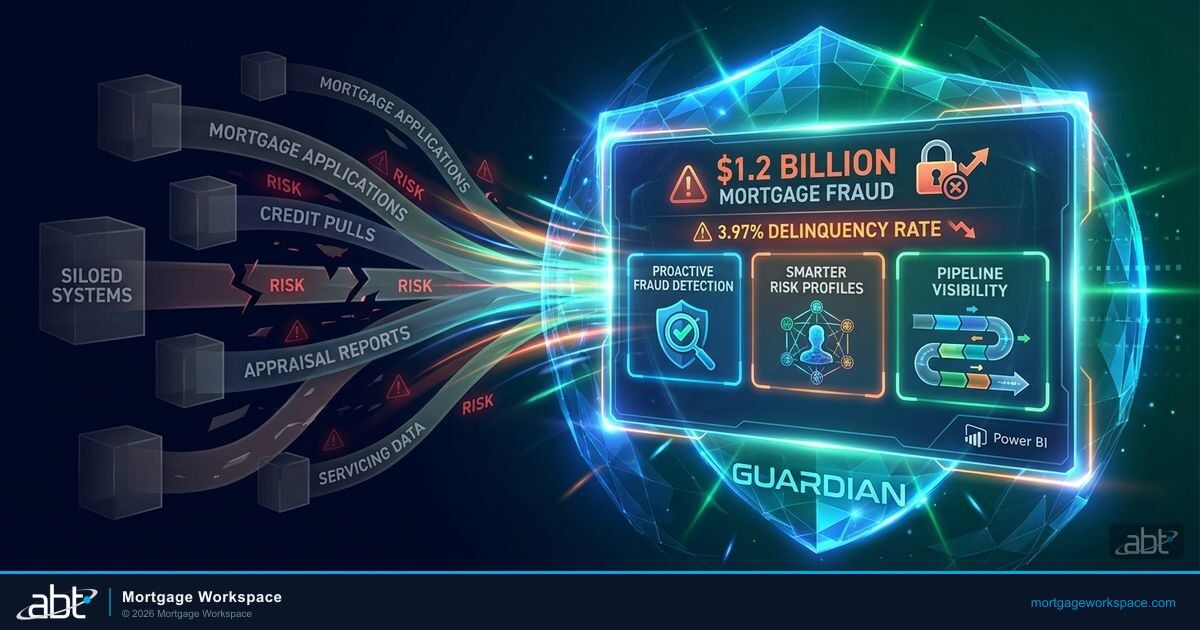
Track best-execution variance to see how often your team hits optimal pricing vs. settling for sub-optimal execution. Monitor pair-off costs from cancelled commitments. Analyze your hedge performance against market movements. Watch days-to-investor-purchase trend by investor and by product. The same dashboards that surface profitability also surface concentration and default risk; the companion analysis in Using Mortgage Business Intelligence for Risk Management walks through how to layer risk views over the profitability view.
Even small improvements in secondary market execution compound quickly. A 2-basis-point improvement in best-execution consistency on $500 million in annual volume is $100,000 in recovered revenue. The Utah Community Credit Union case study mentioned earlier documents 25 to 29 basis points of margin pickup from converting to mandatory delivery with PPE-driven best-execution. On a similar volume base, that scales into multi-million-dollar territory. The lenders who push into that range have a daily secondary marketing dashboard, not a weekly one.
Practical Implementation Steps
You do not need to build everything at once. Start with the metrics that directly affect your bottom line, and add depth as the analytics rhythm becomes routine.
- Connect your LOS data first. Your loan origination system holds the most actionable data for profitability analysis. Pipeline pull-through, cycle time, condition tracking, and originator scorecards all live there.
- Add secondary market feeds. If you sell loans, this is where the biggest margin opportunities hide. Best-execution variance, pair-off cost, days-to-purchase, and hedge performance all need their own dashboard tiles.
- Build branch-level P&L views. Give branch managers visibility into their own numbers, and the conversation about performance shifts from anecdote to data.
- Set up automated alerts. Pull-through rate drops, lock expiration warnings, and margin threshold breaches should trigger notifications when they happen, not when someone runs the report next week.
- Layer in Document Guardian and Mortgage BI integration data. Once the operational baseline is in place, connect document-level compliance signals so the dashboards explain the cost story, not just report the cost number.
Managed IT providers that serve 750+ banks, credit unions, and mortgage companies have the infrastructure expertise to connect these data sources securely and maintain the integrations over time. Mortgage BI dashboards built on this foundation give operations leaders the visibility to make margin-improving decisions every day, not just at month-end.
The bottom line
MBA Q4 2025 production cost of $11,102 per loan is the new pressure baseline. The lenders closing the gap are running BI dashboards that surface pipeline leaks, pricing variance, branch-level cost, and secondary-market execution as a daily worklist. Mortgage BI delivers that surface; Document Guardian and Guardian Productivity Insights extend it into the compliance and team-efficiency layers. The lenders who treat BI as a monthly report stay stuck on the wrong side of the cost gap.
Ready to find the revenue hiding in your data?
Mortgage BI, Document Guardian, and Guardian Productivity Insights are built and managed by ABT for mortgage lenders, banks, and credit unions on Microsoft 365. Get a 30-minute walkthrough of the dashboards your operation should be using.
Frequently Asked Questions
Business intelligence improves mortgage lender profitability by providing real-time visibility into pipeline performance, pricing optimization, branch-level costs, and secondary market execution. BI dashboards identify revenue leaks such as fallen-out loans and expired rate locks, track cost-per-loan by function, and highlight margin opportunities that manual reporting misses. MBA's Q4 2025 Performance Report put per-loan production expense at $11,102, which makes daily BI visibility the difference between top-quartile lenders and the rest.
Cost-per-loan analytics breaks down origination expenses into component categories including personnel costs by function, technology costs per unit, rework and exception expenses, and compliance quality control costs. The Mortgage Bankers Association's Q4 2025 Quarterly Performance Report reported average IMB per-loan production cost at $11,102. BI dashboards help lenders identify which cost categories exceed benchmarks and where process improvements will have the greatest impact on the bottom line.
The pipeline metrics that most affect mortgage profitability are pull-through rates by stage and originator, rate lock expiration rates, concession frequency and dollar amounts, and cycle time from application to funding. Monitoring these metrics in real time allows lenders to intervene before loans fall out and recover margin that would otherwise be lost.
Mortgage lenders start with Power BI or analytics platforms by first connecting their loan origination system data through APIs or data connectors. Next, they add secondary market feeds for gain-on-sale visibility, build branch-level profit and loss views, and configure automated alerts for threshold breaches. Most platforms integrate with existing mortgage technology stacks without requiring system replacements. ABT manages the Microsoft 365 tenant where these dashboards live, including Microsoft Purview data-loss-prevention and Microsoft Entra ID Conditional Access controls.
A typical pricing-analytics implementation recovers 5 to 15 basis points of margin, which equates to $200 to $600 per loan on a $400,000 average loan size. The upper end of what is documented in the market is higher: MarketWise Advisors' 2026 ROI study of Optimal Blue customers measured an average $1,006 net benefit per loan, and Utah Community Credit Union's published case study documents 25 to 29 basis points of margin pickup from PPE-driven best-execution pricing combined with mandatory delivery.
Related Articles
- Business Intelligence for Mortgage Companies: A Practical BI Implementation Guide
- Using Mortgage Business Intelligence for Risk Management
- Why Mortgage Companies Need Business Intelligence Dashboards